Steven Pestana
Email: spestana@uw.edu
GitHub: spestana
Waterhackweek 2020
Sept. 2020
Tutorials: Gridded data & statistics
I gave two tutorials at Waterhackweek, one which covered working with gridded data using xarray, the other introducing some statistics workflows with scipy functions:
- Waterdata - Access and analyze raster and multi-dimensional gridded data: GitHub , YouTube
- Waterstats - Statistics with water data, hypothesis testing, linear regression: GitHub , YouTube
Project: Fire & Water
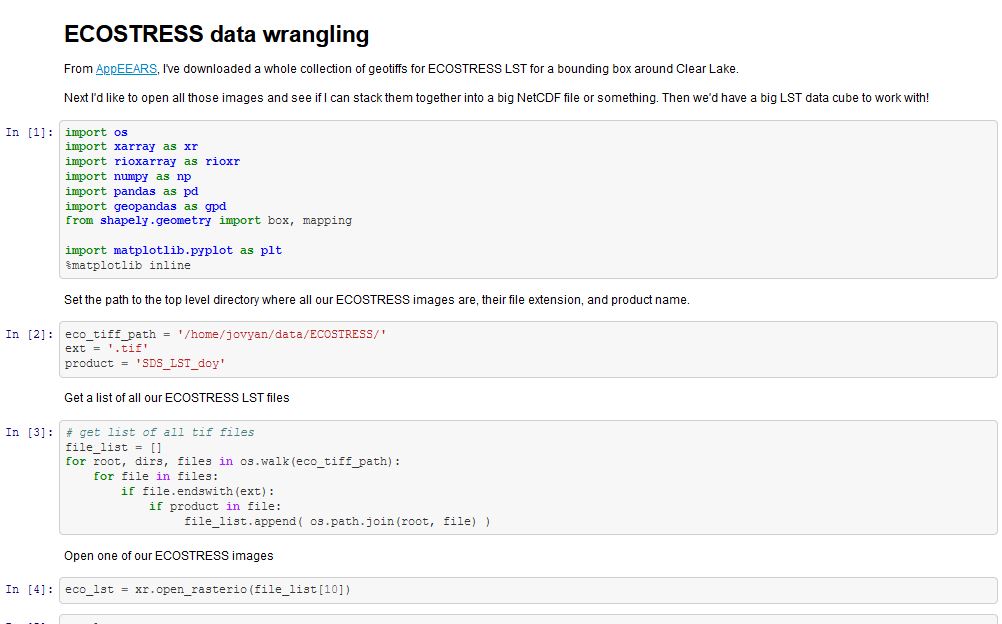
For the hackathon project, our team used thermal infrared imagery from the NASA JPL ECOSTRESS instrument and NASA MODIS products to look at surface temperature and chlorophyll-a changes for Clear Lake in northern California, before and after an adjacent fire in 2019.
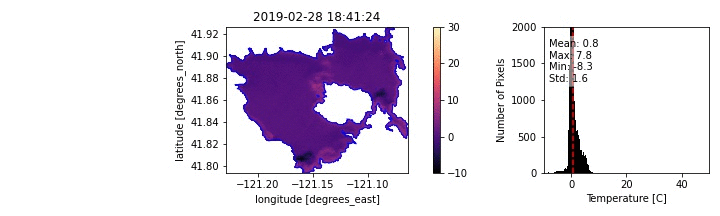
We used open-source python and jupyter notebooks, and cloud-computing resources provided by CUAHSI, to develop a workflow with the ECOSTRESS images: extracting a time series of surface temperatures from within the boundaries of a shapefile before and after the 2019 Tucker Fire. ECOSTRESS data was accessed throu the NASA/USGS/LPDAAC AppEEARS web interface.
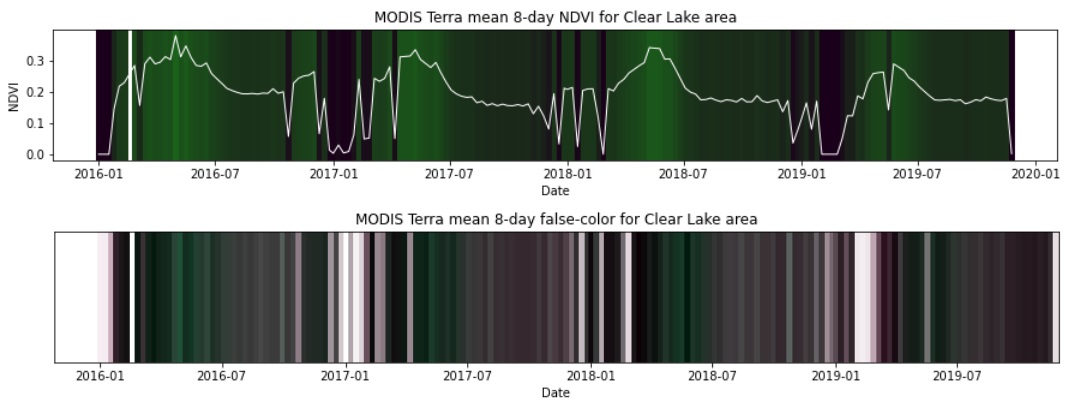
We also learned how to use the Google Earth Engine python API to retrieve several years of MODIS observations of surface temperature, reflectance, and gross primary production. This guide was very helpful.
View the hackathon project files on GitHub
Read more about Waterhackweek here
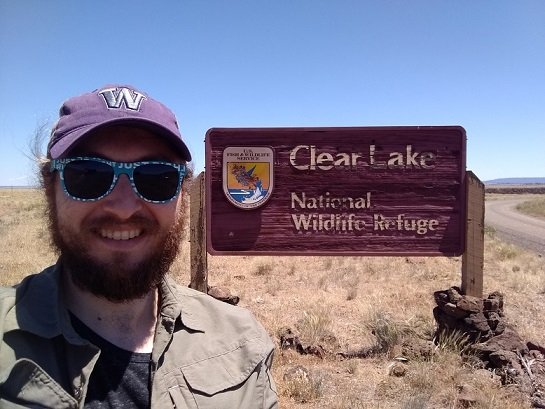
Update: In the summer of 2021, about a year after the hackweek, I was able to visit Clear Lake in person!
- Warming (climate) stripes in python with ulmo
- Teaching Data Analysis in Water Science (Fall 2020)
- American Geophysical Union 2019 Fall Meeting
- Structure from Motion Drone Survey of Easton Glacier
- Structure from Motion Survey of a River Channel