Subset GOES ABI NetCDF files to lon/lat bounds#
[1]:
import xarray as xr
import numpy as np
import glob
import matplotlib.pyplot as plt

import goes_ortho
Define the lat/lon bounds we want
bounds = (minimum latitude, maximum latitude, minimum longitude, maximum longitude)
[2]:
bounds = (30, 50, -125, -105)
Specify the file we want to crop to these bounds
And provide a new filename for saving the new cropped image.
[3]:
filepath = '/storage/GOES/goes17/2020/3/3/ABI-L1b-RadC/00/C03/OR_ABI-L1b-RadC-M6C03_G17_s20200630001176_e20200630003549_c20200630004001.nc'
new_filepath = '/storage/GOES/goes17/2020/3/3/ABI-L1b-RadC/00/C03/OR_ABI-L1b-RadC-M6C03_G17_s20200630001176_e20200630003549_c20200630004001_clipped.nc'
Subset GOES ABI image to these bounds and save to new file
[4]:
goes_ortho.subset_abi_netcdf(filepath, bounds, new_filepath)
Subsetting
/storage/GOES/goes17/2020/3/3/ABI-L1b-RadC/00/C03/OR_ABI-L1b-RadC-M6C03_G17_s20200630001176_e20200630003549_c20200630004001.nc
 to these bounds:
        (-125,50).      .(-105,50)


        (-125,30).      .(-105,30)
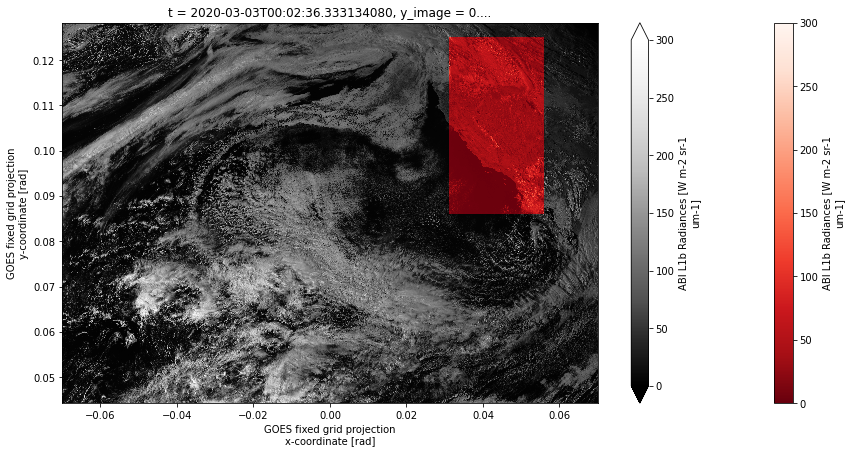
Load the original and the subset image and overlay the two
[5]:
original = xr.open_dataset(filepath)
new = xr.open_dataset(new_filepath)
[6]:
fig, ax = plt.subplots(1,1, figsize=(15,7))

new.Rad.plot.imshow(ax=ax, cmap='Reds_r', vmin=0, vmax=300, zorder=1)
original.Rad.plot.imshow(ax=ax, cmap='Greys_r', vmin=0, vmax=300, zorder=0)
[6]:
<matplotlib.image.AxesImage at 0x7f9291f4ba58>
[ ]: